

Widgets Overview

Views
Widgets overview page covers all the widget types available to users under the Dashboard creation section. The widgets help you present your survey data in visual form. Survey2Connect offers you 13 widget types including NPS chart and word cloud. The widgets available are:
Bar Chart
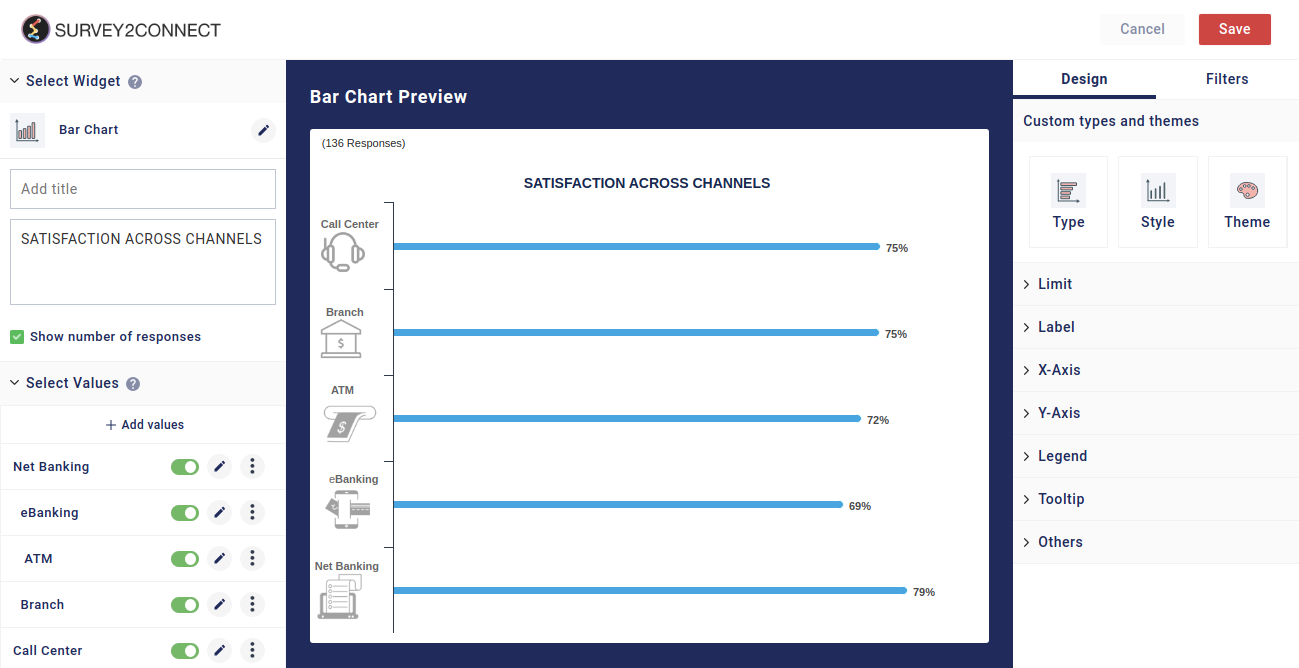
Bar Chart presents categorical data with rectangular bars with heights or lengths proportional to the values that they represent.
Pie Chart
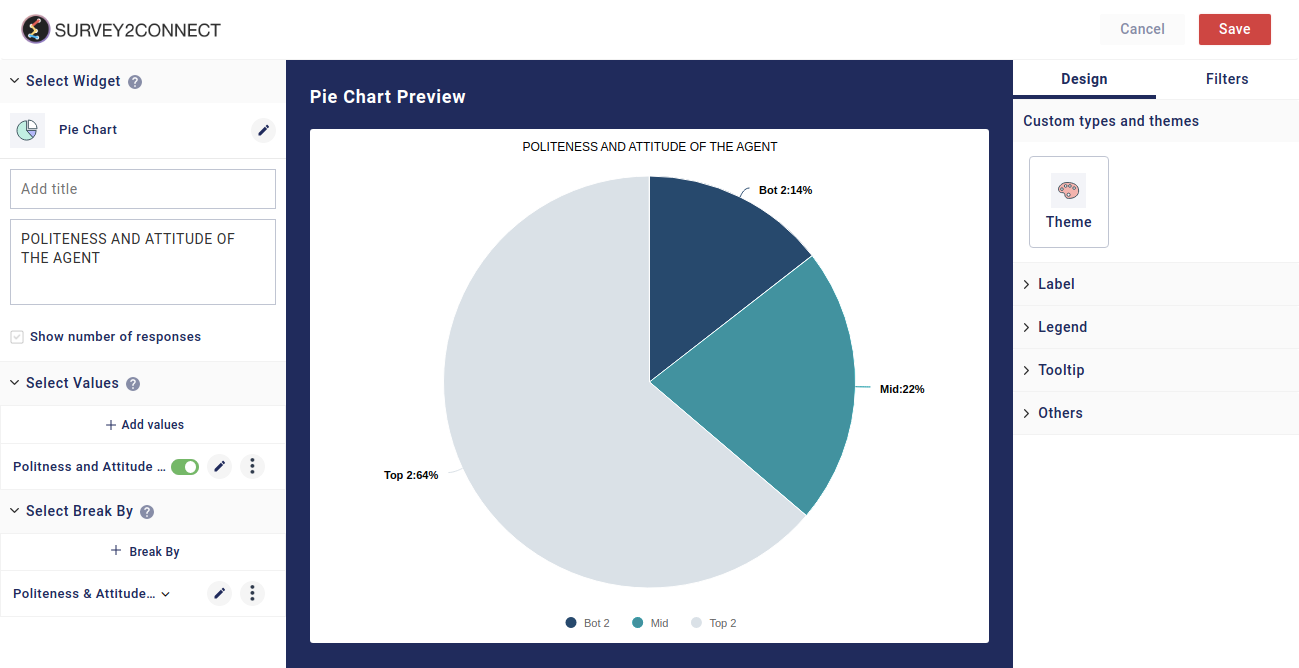
Pie Chart is a circular statistical graphic. It is divided into slices to show the numerical proportion of all the answer choices.
Donut Chart
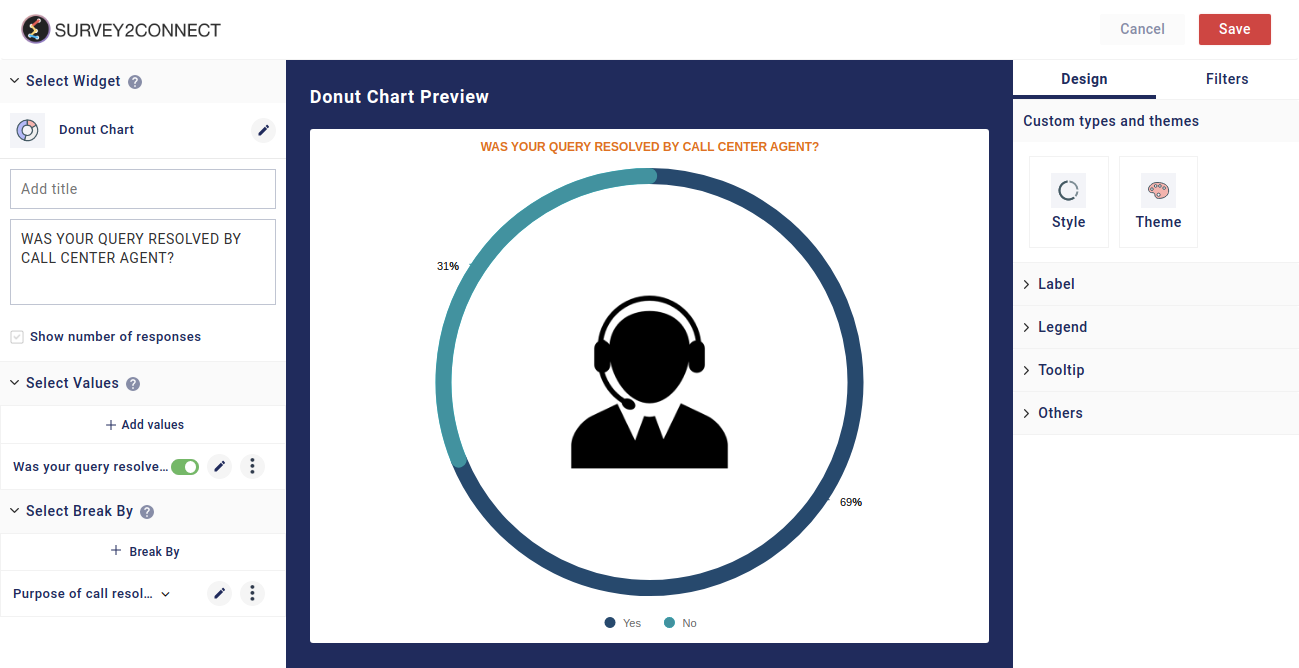
Donut Chart is similar to Pie Chart except Donut Chart has slices fixed together. Each slice represents an answer choice.
Line Graph
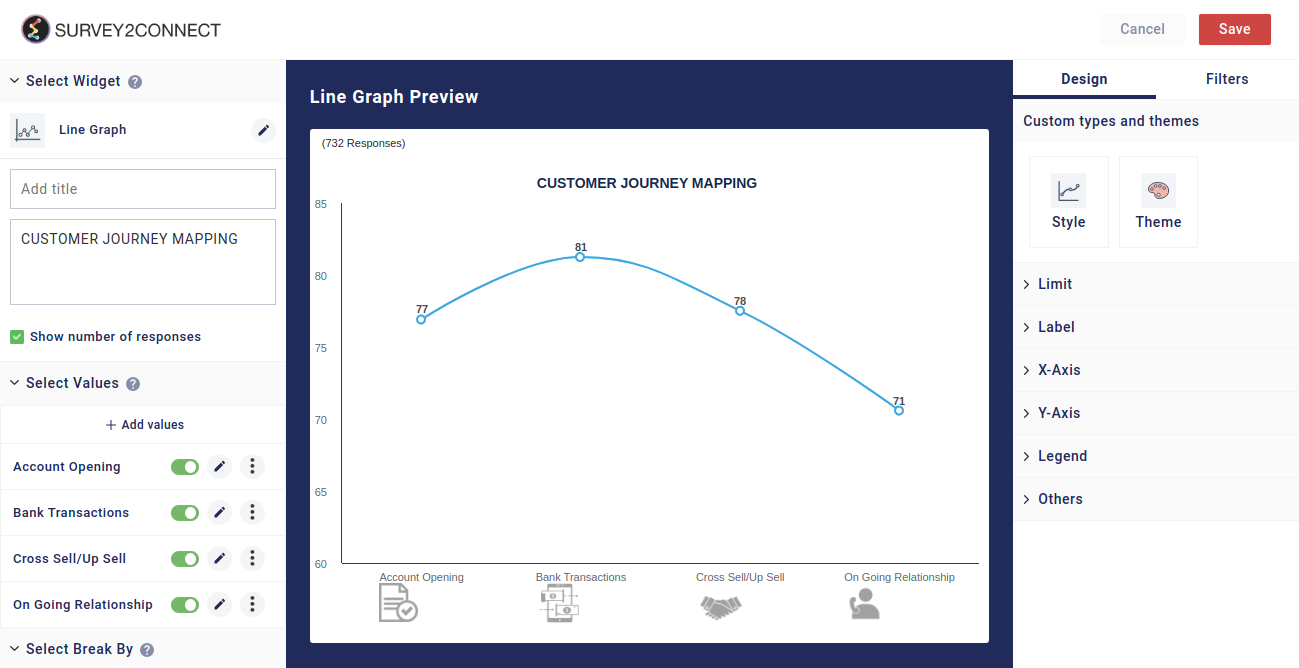
Line Graph widget type is used when you want to show information that has witnessed a change over time.
Area Graph

Area Graph is similar to Line graph. The only difference between the two is that Area Graph has the area filled under the line
Gauge Chart
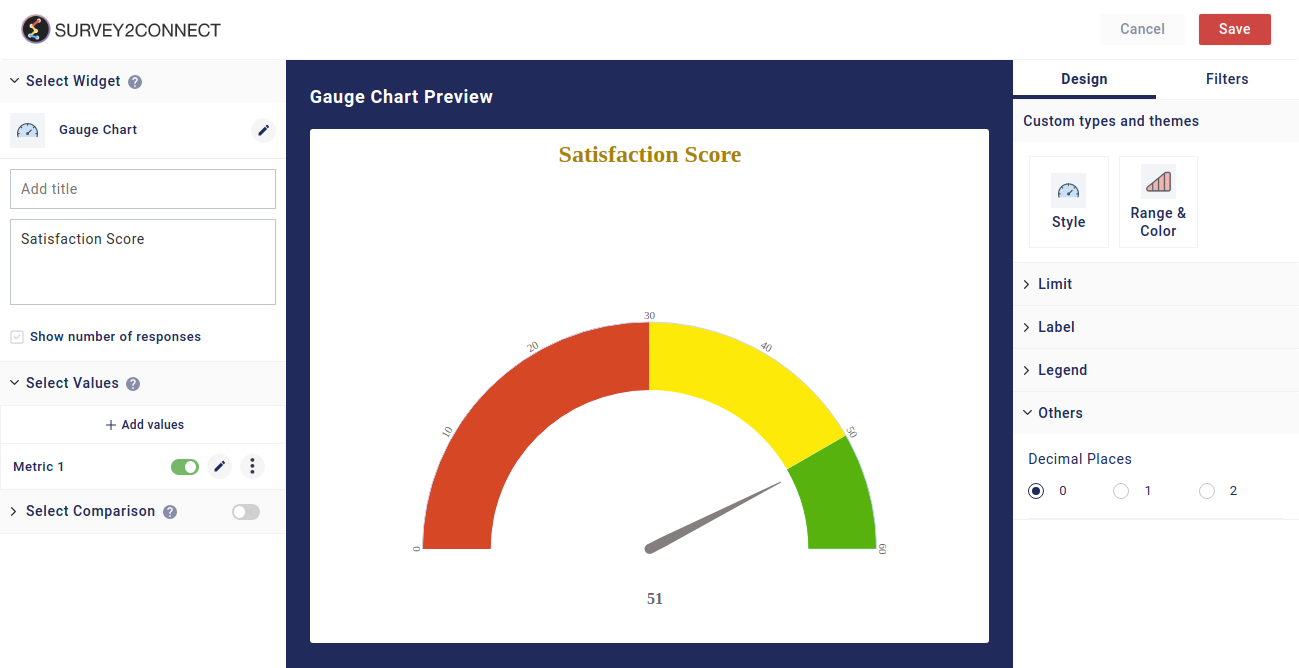
Gauge charts are also known as dial charts. They resemble the speedometer and it uses needles to show data points or information.
NPS Chart
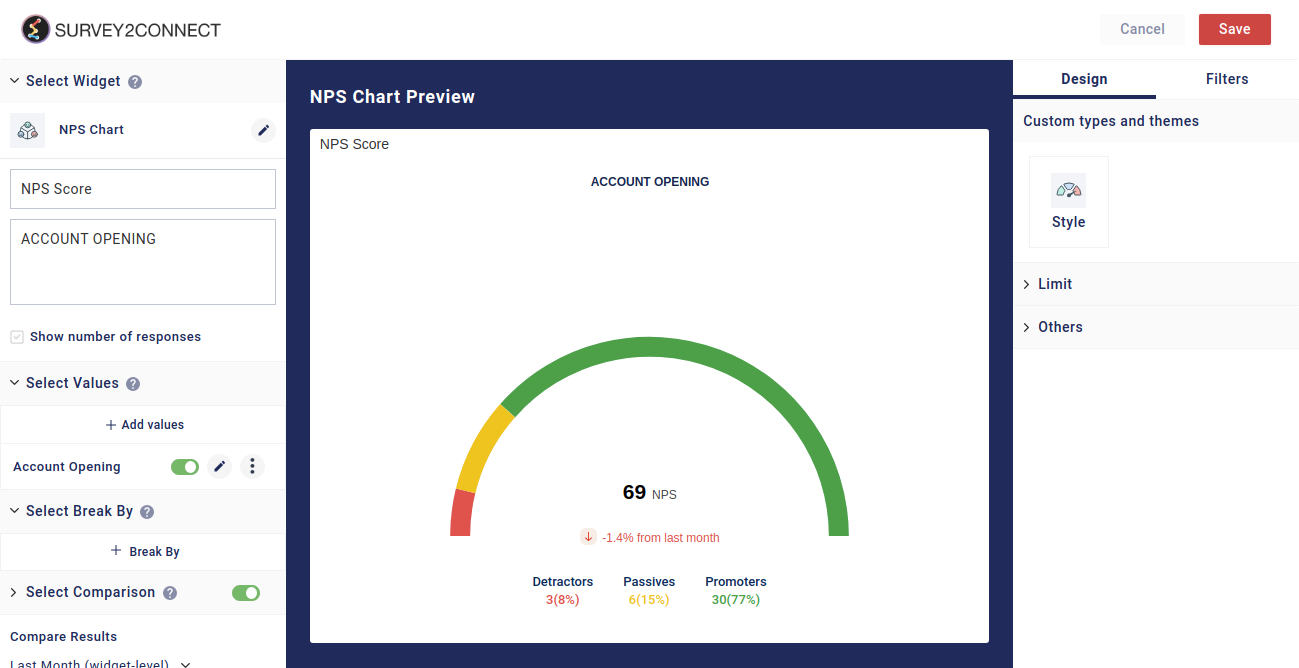
NPS Charts are used to showcase the NPS data you have acquired from your survey. You can showcase your NPS score on the dashboard via this widget easily.
Data Trends
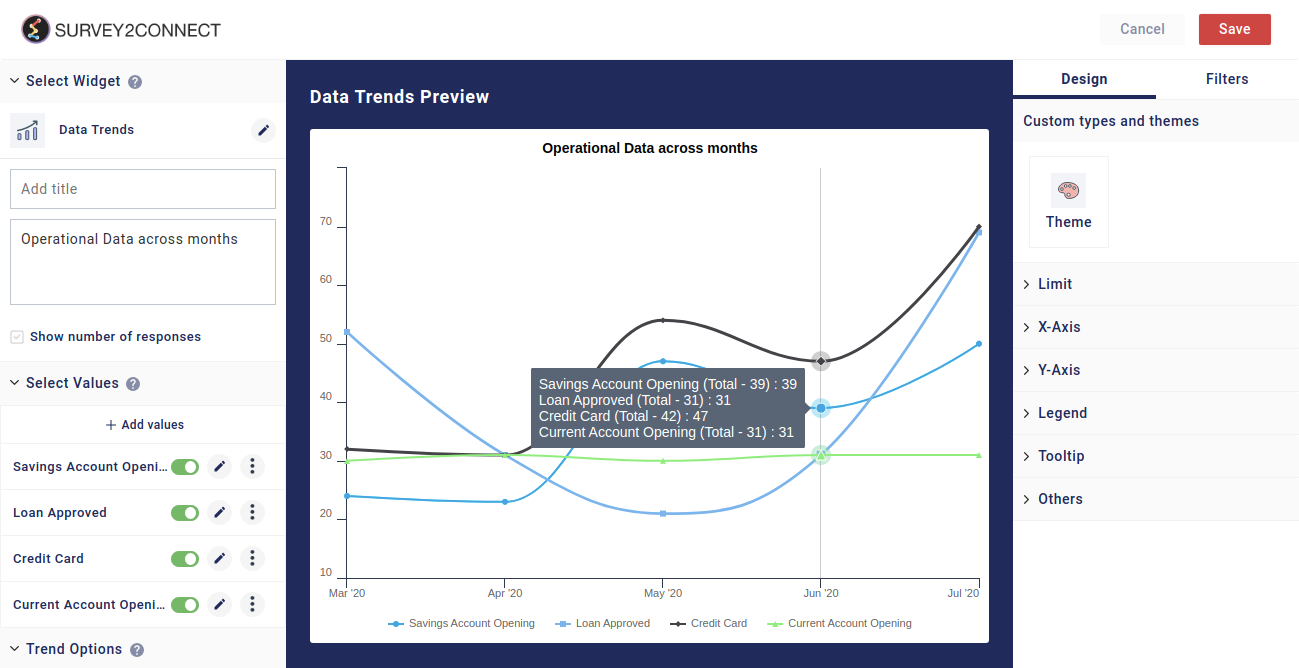
Data Trends widget is used when you want to show the data trend in your survey data. This traces the change in data with graphs or bars or lines.
Simple Table
 Simple Table widget lets you create a simple table to represent your data. You can add a static row with a set value.
Response Table

Response Table widget showcases all the survey responses from the data source in a tabular manner with the question numbers and their respective answers.
Image

You can add an image to your dashboard using Image widget from your widgets overview page. This is used to add images to the Dashboard.
Rich Text
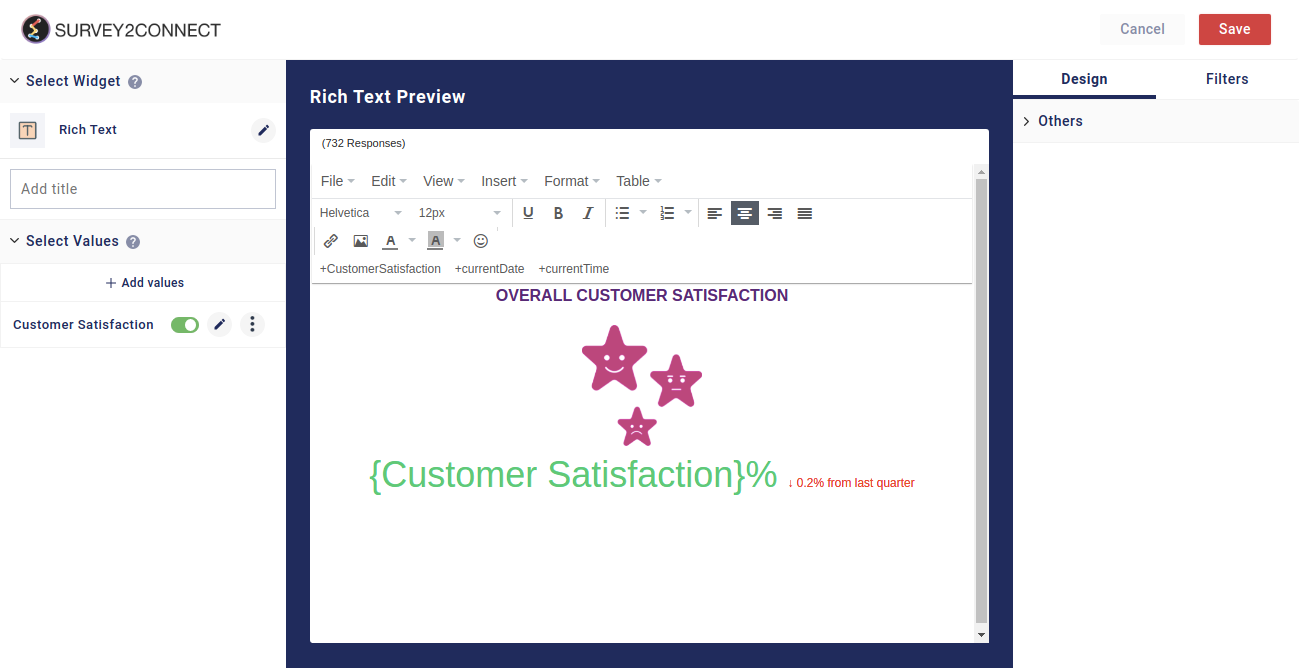
Rich Text lets you add text to your Dashboard. The rich text widget operates like an MS Word File and you can create a document to be shown in your dashboard.
Wordclould
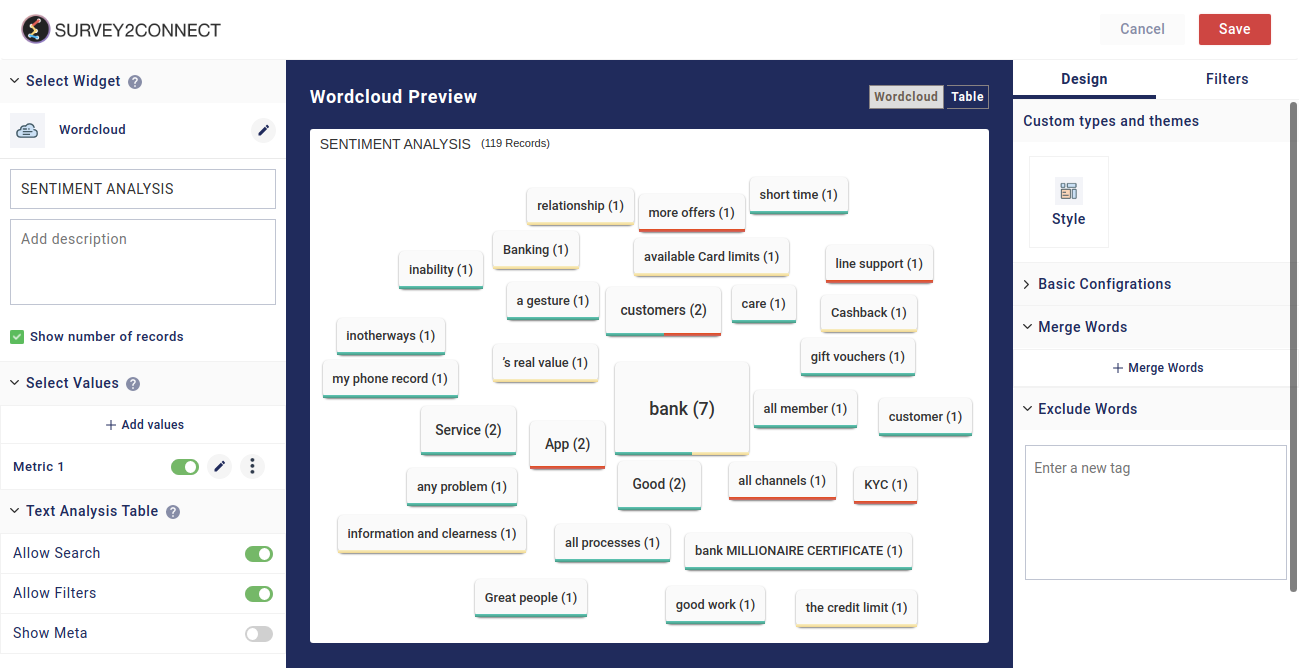
Wordcloud is a visual representation of the text data arranged together to showcase human sentiment by your respondents. You can see all the word clouds and the entire comment alongside the word.
CSAT
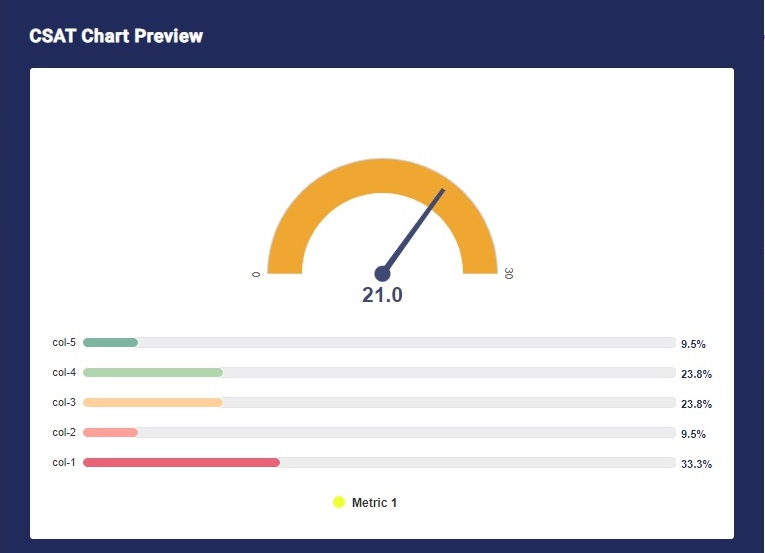
CSAT widget helps you showcase the customer satisfaction level based on the ratings they have given you. The widget calculates the satisfaction result and shows it using either a Gauge or Linear or Numeric Scale.
Mutli CSAT
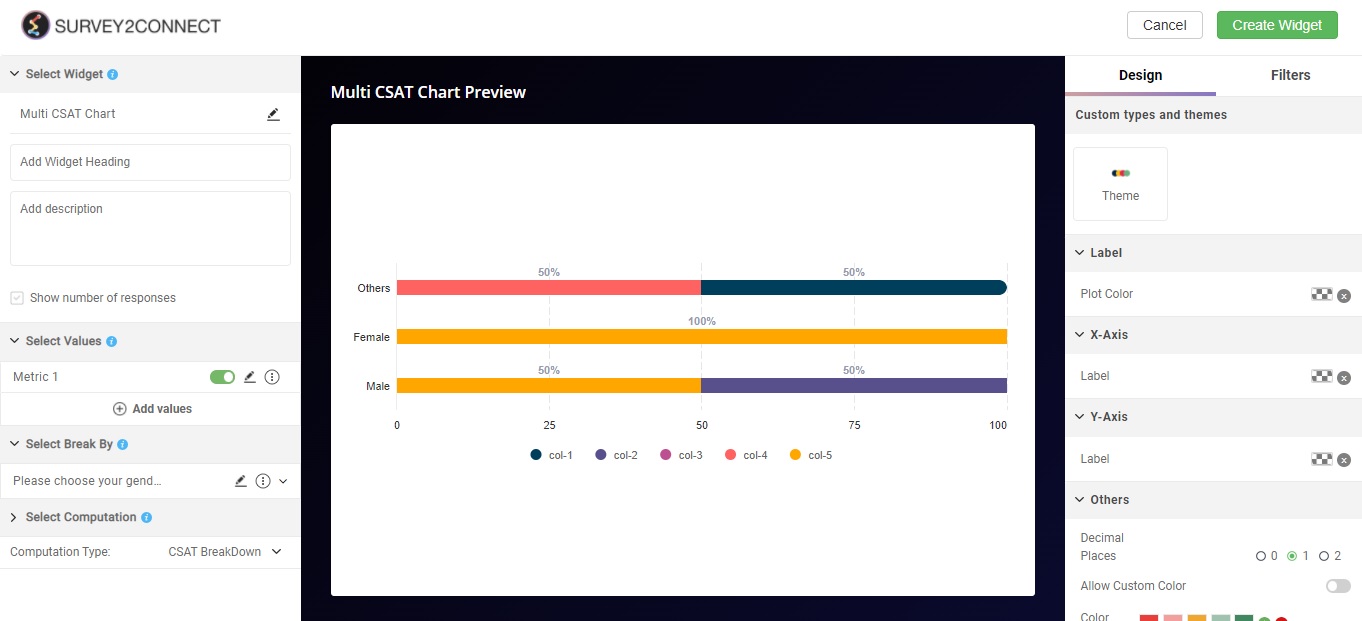
Similar to CSAT widget, the multi CSAT is used when you wish to showcase multiple CSAT scores in a single widget.