
Response Table

Views
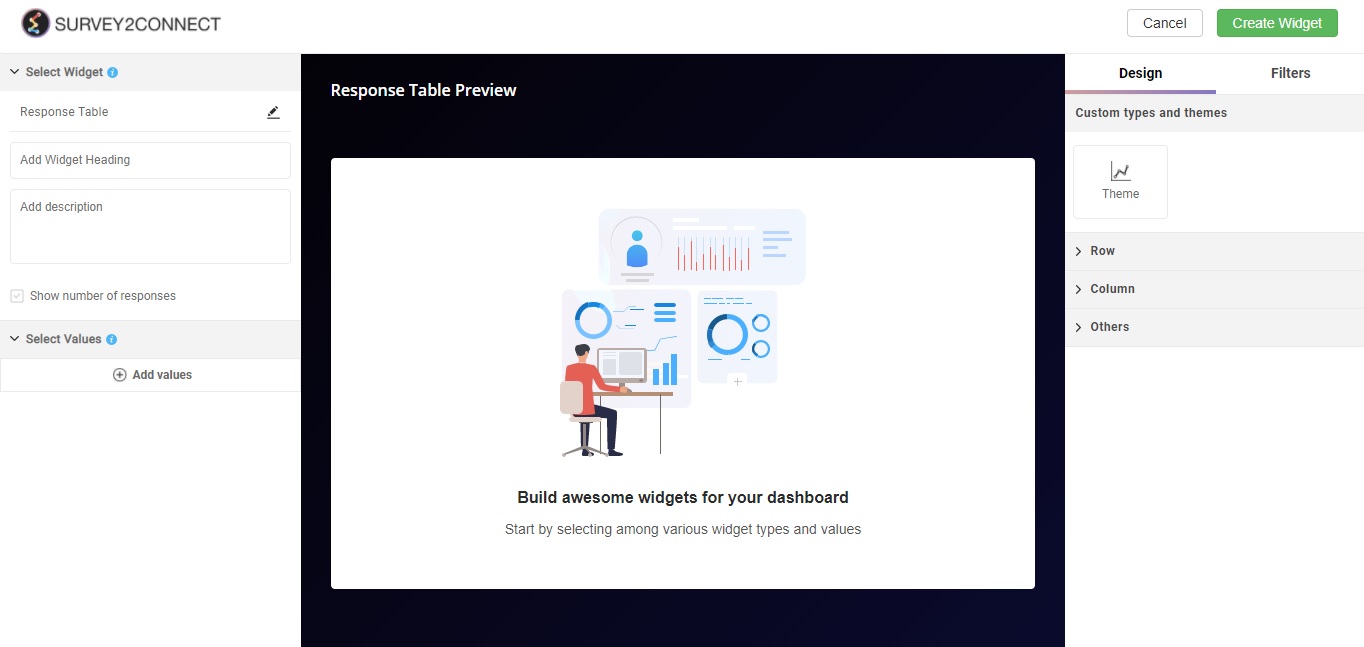
Response Table widget is used to show the survey response for a particular question/ combination variable. This widget is used when you wish to show the survey response in a widget. Once you select the data field in the widget, it shows you all the responses for the question/variable in a tabular manner.
Use of Response Table
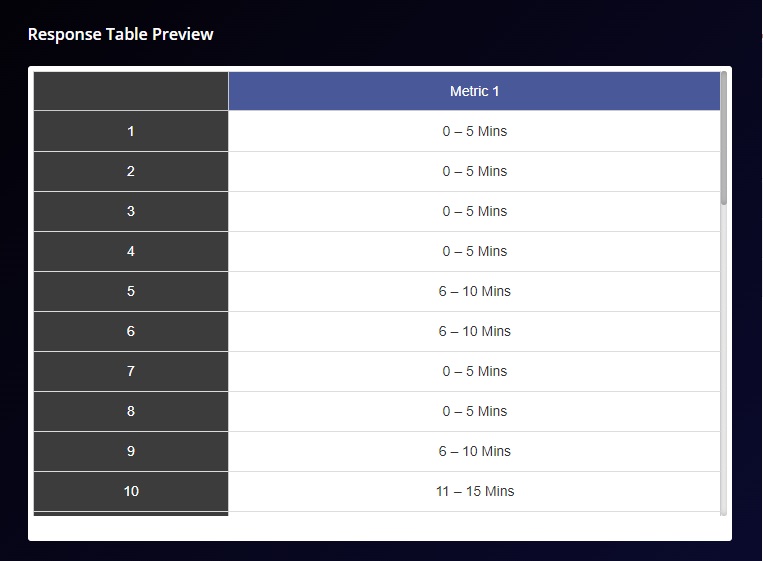
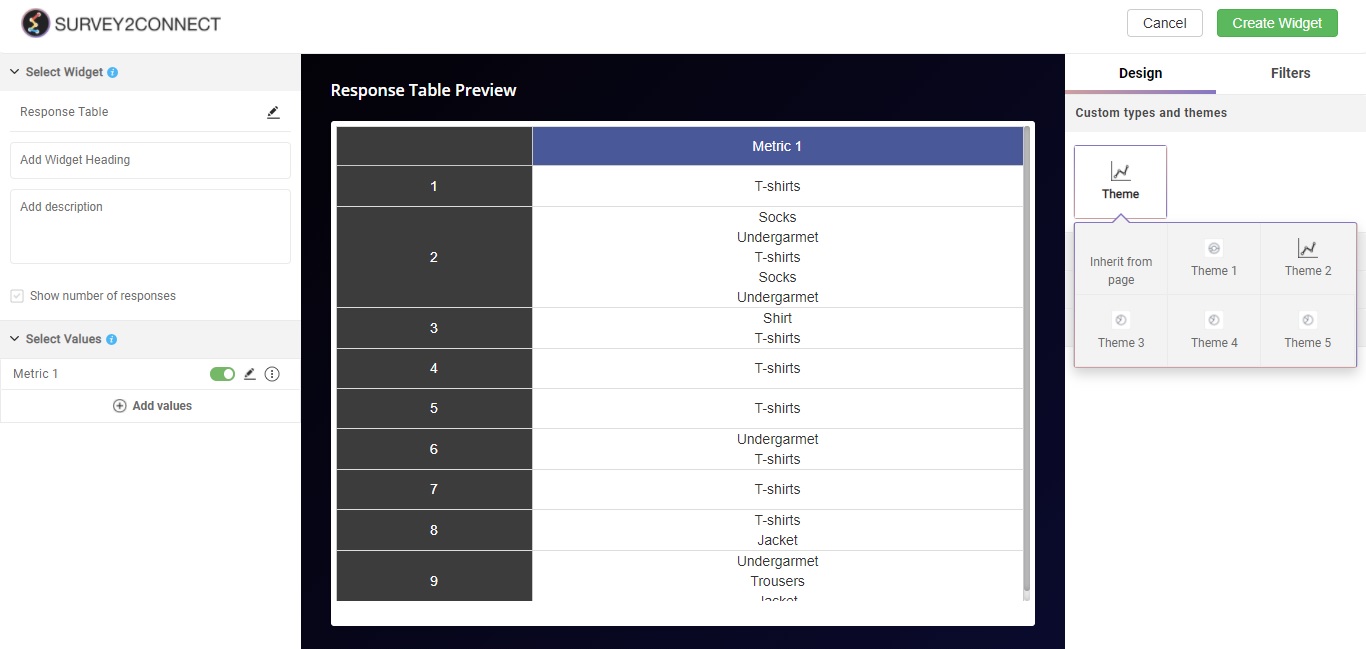
The primary use of the Response Table is to showcase all the responses for a particular question in a tabular manner. Below is an example of a response table where we have selected a question that talks about how long it took for the business to get back to you for your complaint.
You can further customize the widget with these available options:
Widget Heading: You can add a widget heading that would appear on top of the widget. You can also insert piping using the Break by data. You can also pipe filter in the widget heading that can be seen on the Dashboard page. The widget heading allows you to give viewers an idea of what the widget depicts.
Widget Description: You can add a widget description that would appear on top of the widget. This allows you to mention details about the widget. You can make changes to alignment, text color, text size with the options available. The customizable options are:
-
- Bold: This allows you to make your text bold
- Text size: You can change the size of the text using this option
- Text Color: You can manage the color of the text from this option.
- Alignment: This option allows you to choose between three alignment options — Left, center and right.
- Insert Piping: This option lets you pipe information. The available options are total, month, widget-time-filter and global-time-filter. The total shows you the total count of the responses, month shows you the month of widget creation, widget time filter shows you the time as per the widget.
Show Number of Response: When enabled, this option would allow you to show the total number of responses on the top left side of the widget.
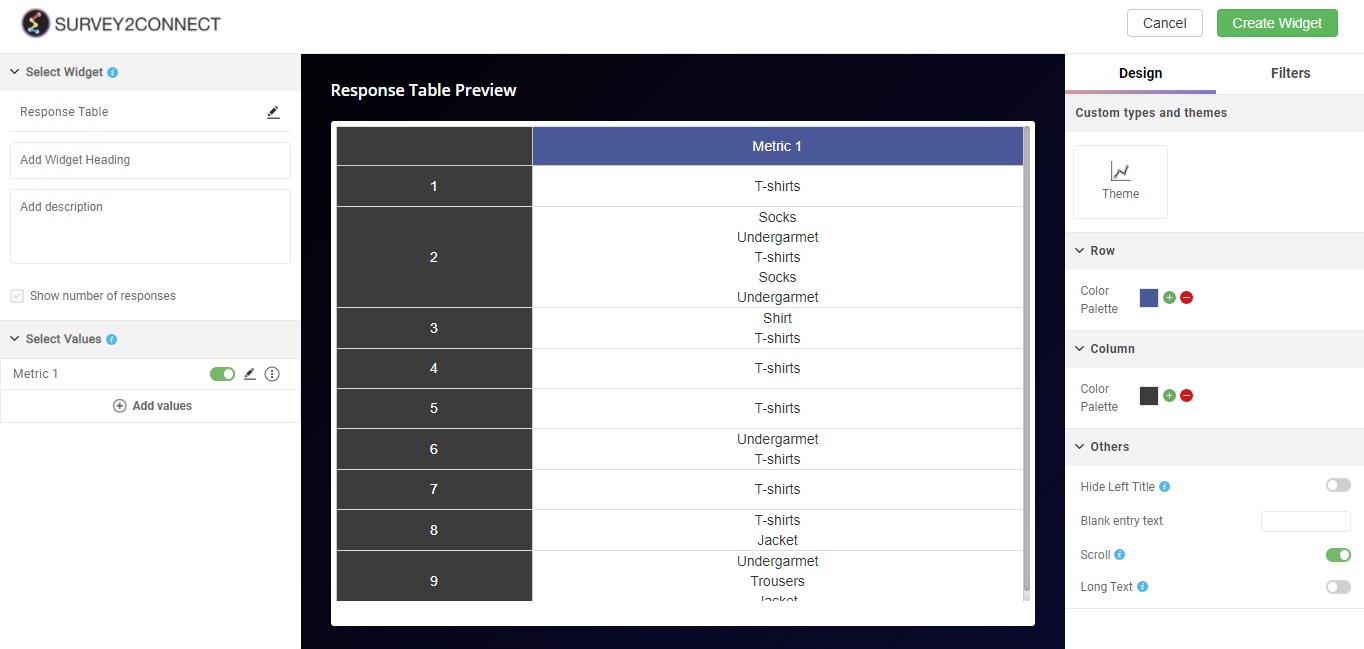
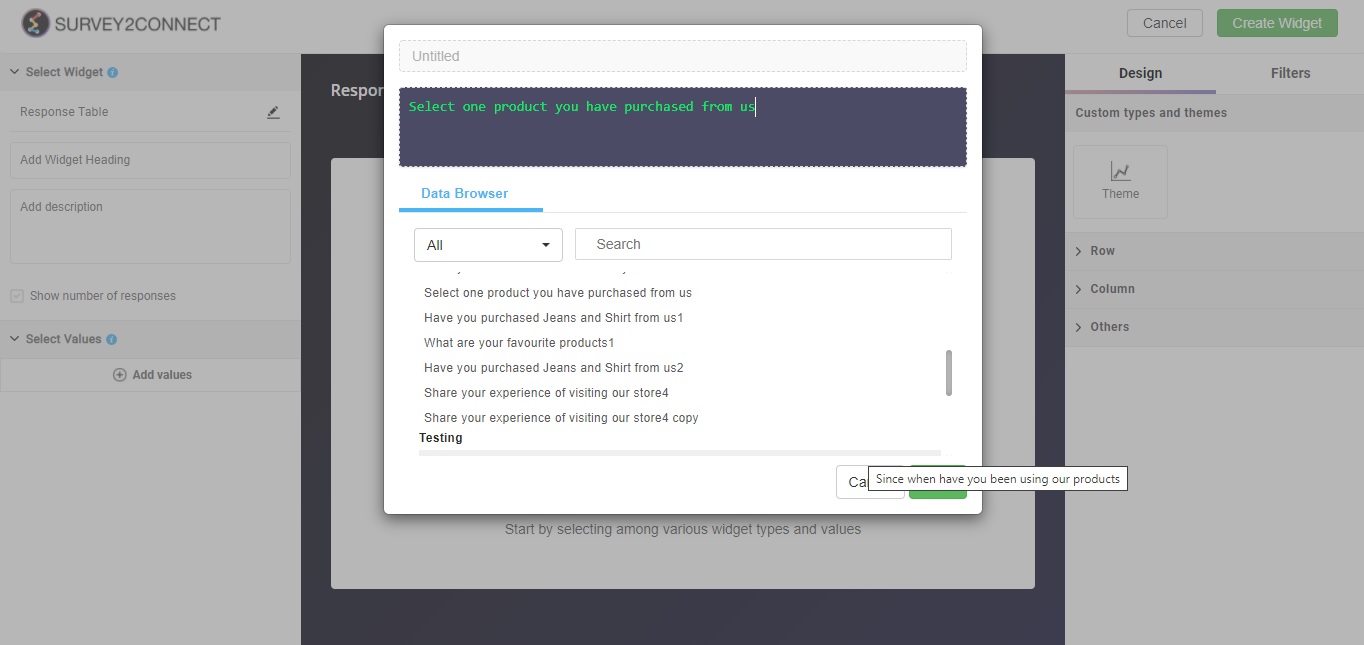
Select Value: This option lets you select the value for the chart. This value can be a question in the survey, metadata field, group variable, or combined variable. Users can select it in this widget.
Sub-option of Select Value: There are minor customization options available under each Metric that you have added.
- Rename: This option lets you rename the Metric
- Duplicate: This option lets you duplicate the metric
- Delete: This option lets you delete the particular metric.
Designs: This option lets you manage the design of the table. With Survey2Connect, you have the option to customize the designs of the widget. You can change the theme using this option.
-
- Theme: You can toggle between different themes using this option. There are a total of 6 theme options available for the widget.
Row: This option lets you manage your rows in the table.
-
- Color Palette: This option lets you change the color of the row
Columns: This lets you customize the columns in your chart
-
- Color Palette: This option lets you change the color of your column
Others: There are many other options available, this lets you manage them.
-
- Hide left Title: This option lets you hide the left row completely. Once you do that, you will only be shown the answers in the right column.
- Blank Entry Text: This option lets you show the text for the blank entries. This comes in handy for those responses where there are no answers. In such a case, this blank entry text would replace the blank entry.
- Long Text: This option allows you to include the long text answers in your table. This is useful when the question or the variable consists of a long text question type. Enabling this option would show you the entire long text response.