
Data Trends

Views
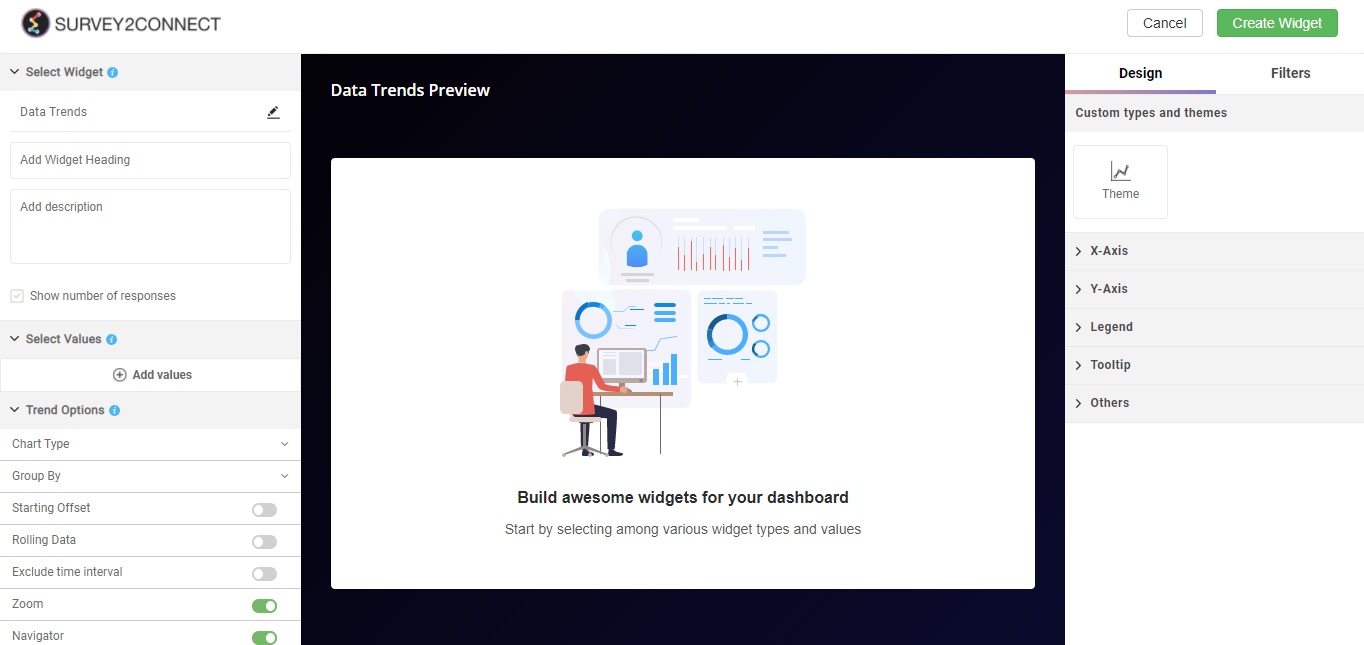
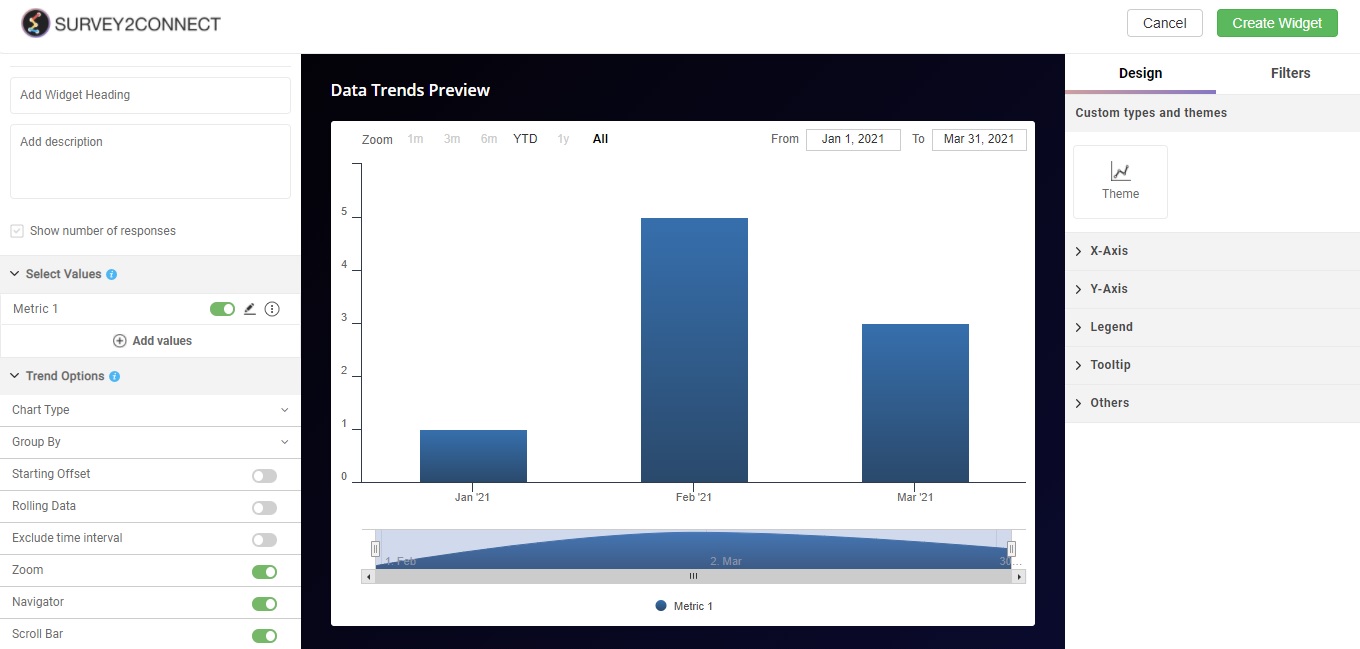
Data Trends widget is used to show the data trend in your survey result. Data trends track the collective data to show a trend in the result, giving us a prediction of where the data leads us to.
Use of Data Trends
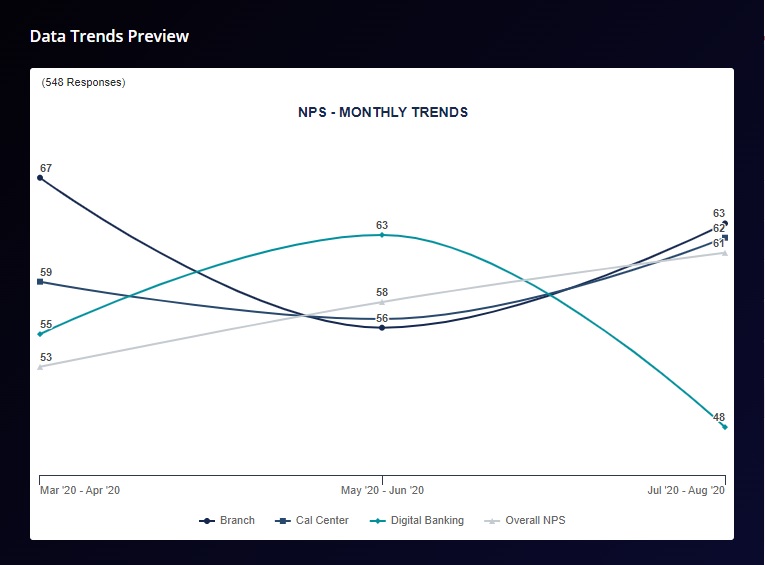
Data trends are used to showcase the change in data sets over a period of time. Let’s say you want to analyze your rating or NPS for a particular parameter over three months to analyze the change in data, you can use a Data trends chart to showcase your data.
For example, you have asked for NPS across 4 parameters — Branch, Call Centre, Digital Banking, and Overall NPS. Now you want to see the change in NPS over a period of three months or more, you can use Data trends to do that.
There are few customizable options available:
Widget Heading: You can add a widget heading that would appear on top of the widget. You can also insert piping using the Break by data. You can also pipe filter in the widget heading that can be seen on the Dashboard page. The widget heading allows you to give viewers an idea of what the widget depicts.
Widget Description: You can add a widget description that would appear on top of the widget. This allows you to mention details about the widget. You can make changes to alignment, text color, text size with the options available. The customizable options are:
-
- Bold: This allows you to make your text bold
- Text size: You can change the size of the text using this option
- Text Color: You can manage the color of the text from this option.
- Alignment: This option allows you to choose between three alignment options — Left, center and right.
- Insert Piping: This option lets you pipe information. The available options are total, month, widget-time-filter and global-time-filter. The total shows you the total count of the responses, month shows you the month of widget creation, widget time filter shows you the time as per the widget.
Show Number of Response: When enabled, this option would allow you to show the total number of responses on the top left side of the widget.
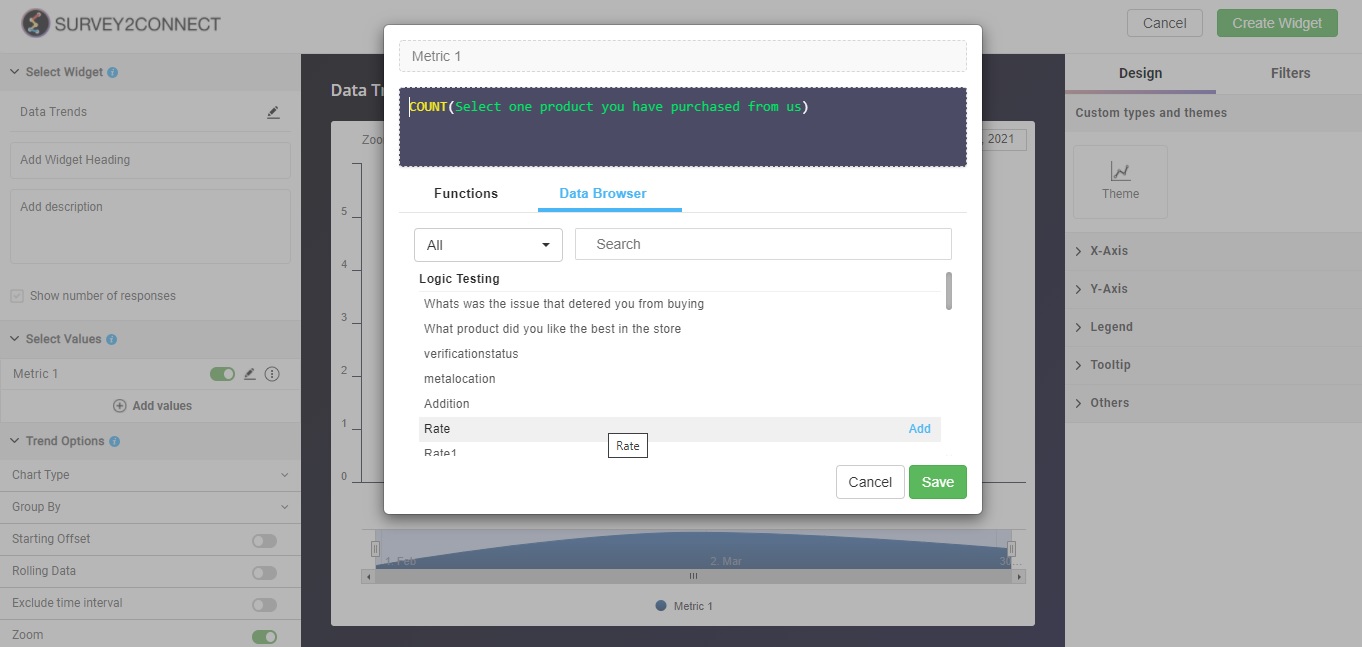
Select Value: This option lets you select the value for the chart. You can add multiple values to your chart. Users can select the question and function in this option:
-
- Function: This option lets you select the function, which acts as a mathematical equation for the data available. You can select from the options available.
- Data Browser: This option lets you select the question whose data would be used in the chart.
- Change Color: This option lets you change color of the data point for the particular metric
- Rename: This option lets you rename the Metric
- Duplicate: This option lets you duplicate the metric
- Delete: This option lets you delete the particular metric.
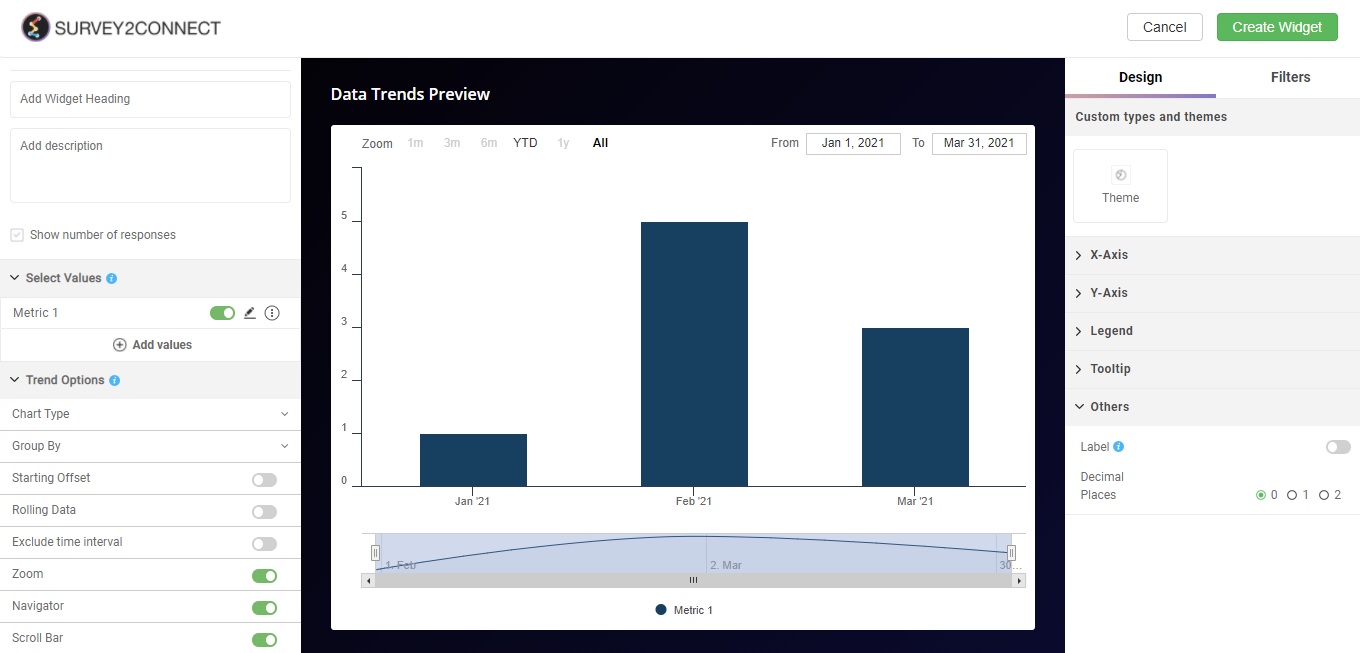
Trend Options: This option allows you to customize your data trend chart using numerous available options:
- Chart Type: This option is used to select a chart type. The options available are — Line, Area, Spline, Area Spline, Bar. Line Chart would just show the lines on a 2D graph while Area would be like Area Chart. You can also use Spline, which is similar to a line graph but the edges are curved.
- Group By: This option allows you to group your data on the basis of the different time periods. You can select between a day to 6 months.
- Starting Offset: The number you select here would be the number of data points removed from the X-axis. If you select 2, 2 data points would be removed from the start.
- Rolling Data: Rolling data adds the previous data with the current data to show a sum. For example, if you have data trends of 7 days and have added 1 as the value for rolling data, it would add one previous value to the current value.
- Exclude Time Interval: This option lets you exclude a particular time interval from your data point. For example, if you have selected 6 months time period and wish to omit a particular month, you can select the month from this option and the data for that time period won’t reflect in the data trends chart.
- Navigator: This option lets you hide the navigator bar under the data trends chart
- Scroll Bar: This option lets you hide the scroll bar in the navigator.
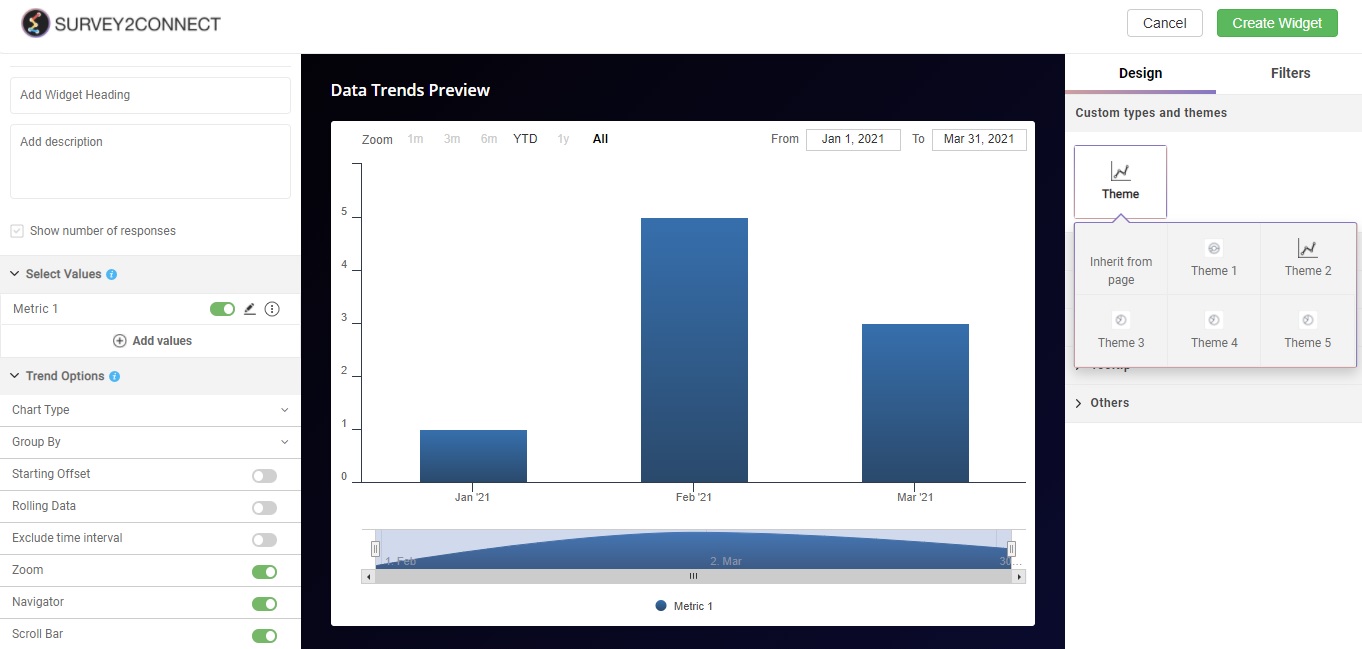
Designs: This option lets you manage the design of the Gauge Chart. You can change the chart type, style, and design.
-
- Theme: This option allows you to toggle between different themes options of the trends chart available. There are a total of 6 options available.
Limit: This lets you decide the maximum and minimum value that would be shown on the Y-axis of the trends chart. By default, it is set at zero and the maximum value that any individual data set has.
- Maximum: This lets you set the maximum value
- Minimum: This lets you set the minimum value
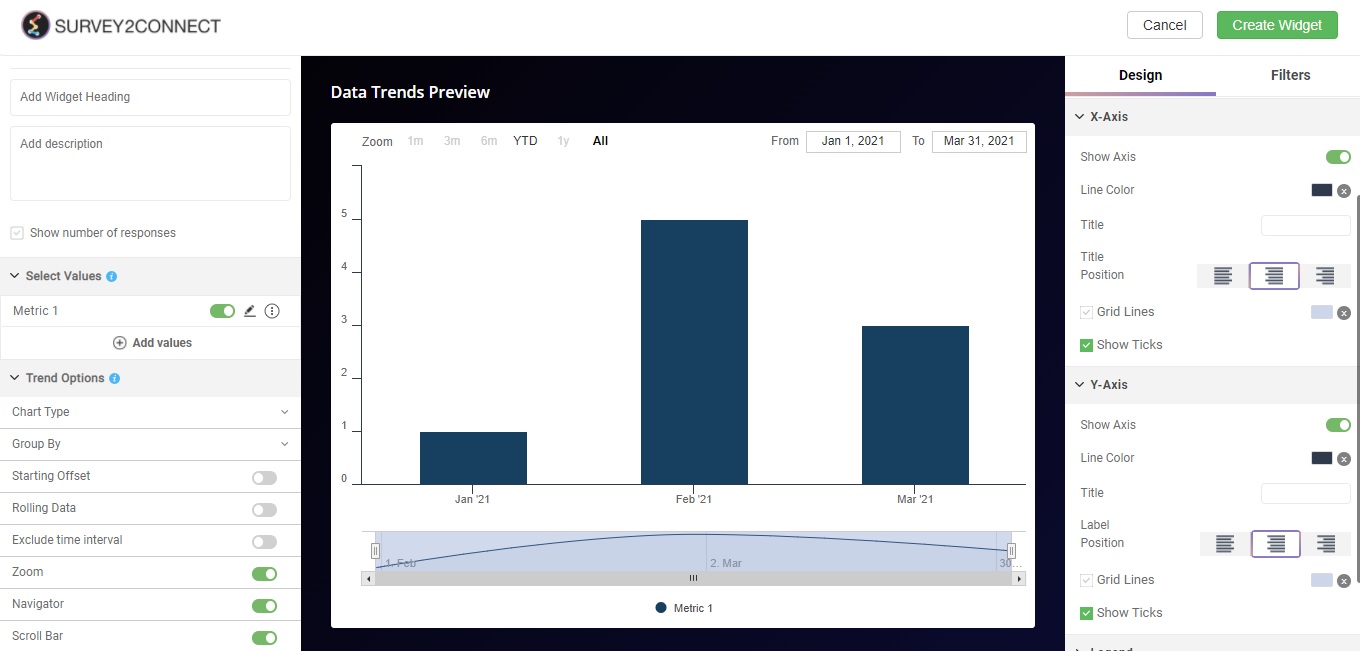
X-Axis: This option lets you manage the design for the X-axis
-
- Show Axis: This option lets you disable and enable the X-axis line
- Line Color: This option lets you change the color of the X-axis line as per your design need.
- Title: Using this option you can give the name to the Axis, which would make it easier to comprehend what the axis signifies.
- Title Position: You can toggle between the left, center, and right positions for the title.
- Grid Lines: This option lets you have a line between two bars. It would make it easier to separate two or more data sets on the widget.
- Show Ticks: This option lets you disable the tick, which separates different data points on the axis
Y-Axis: This option lets you manage the design for the Y-Axis
-
- Show Axis: This option lets you disable and enable the Y-axis line
- Line Color: This option lets you change the color of the X-axis line as per your design need
- Title: Using this option you can give the name to the Y-axis which would make it easier to comprehend what data type the axis signifies.
- Label Position: This option lets you manage the position of the label.
- Grid Lines: This option lets you have a line between two data sets. For example, if your Y-axis has 0 to 10 as its labels, this option would create a grid line for every number, making it easy to comprehend your bar’s data in relation to Y-axis.
- Show Ticks: This option lets you disable the tick, which separates different data points on the axis
Show Legend:Legend refers to the metric details shown with the bar which indicate what the individual bar represents. For example, if you have Yes and No as two options, the legend is the detail which shows Yes and No and their respective color. You can toggle between four positions available — Top, Bottom, Left, and Right.
Tooltip: Tooltip refers to the information shown when you hover the cursor over the bar. You can toggle it off or on.
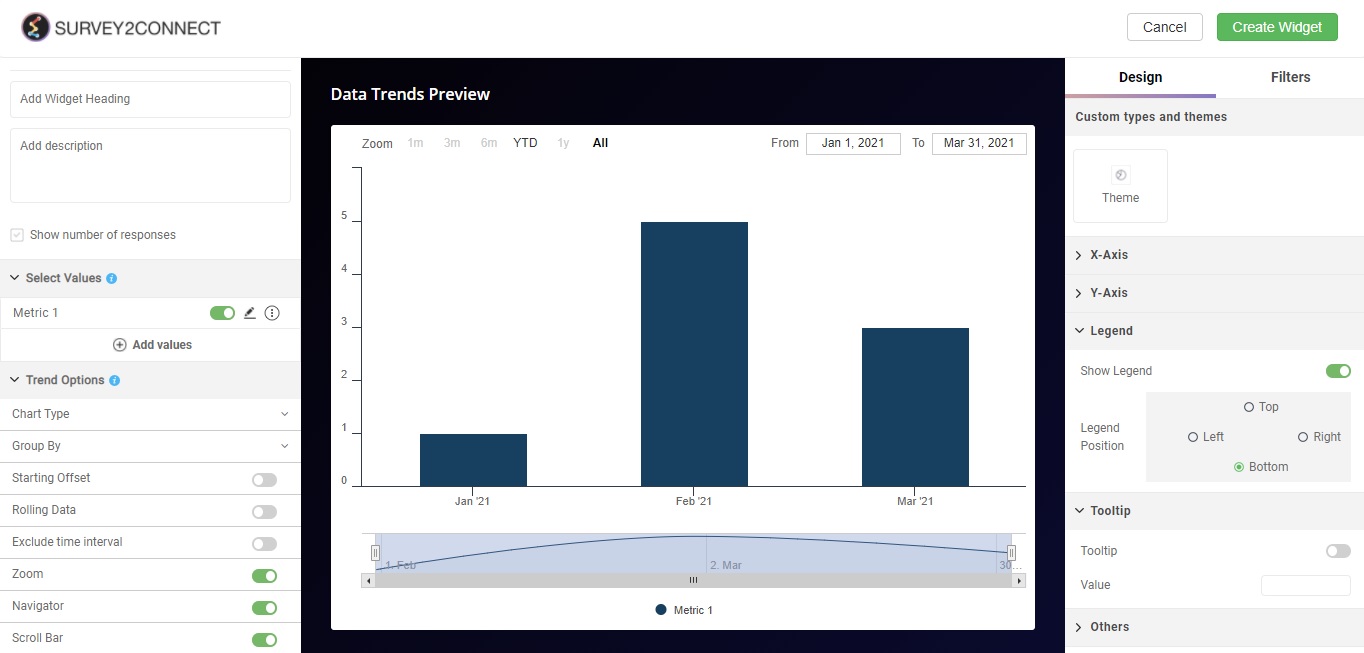
Others: There are other options available that can be customized.
-
- Labels: Enabling this option shows you the value of each data set on the chart
- Decimal Places: You can select how many decimal places will be shown in the data