
Question Summary Page Overview

Views
Question Summary page overview gives you a brief idea of features available for you on the page. Question Summary allows you to analyse the data on the basis of the question. It shows you the data for each question and you can add filters, compare data, save them and export them. You can also customise the display setting of the data as per your need. Check out the features available in the Question Summary page overview.
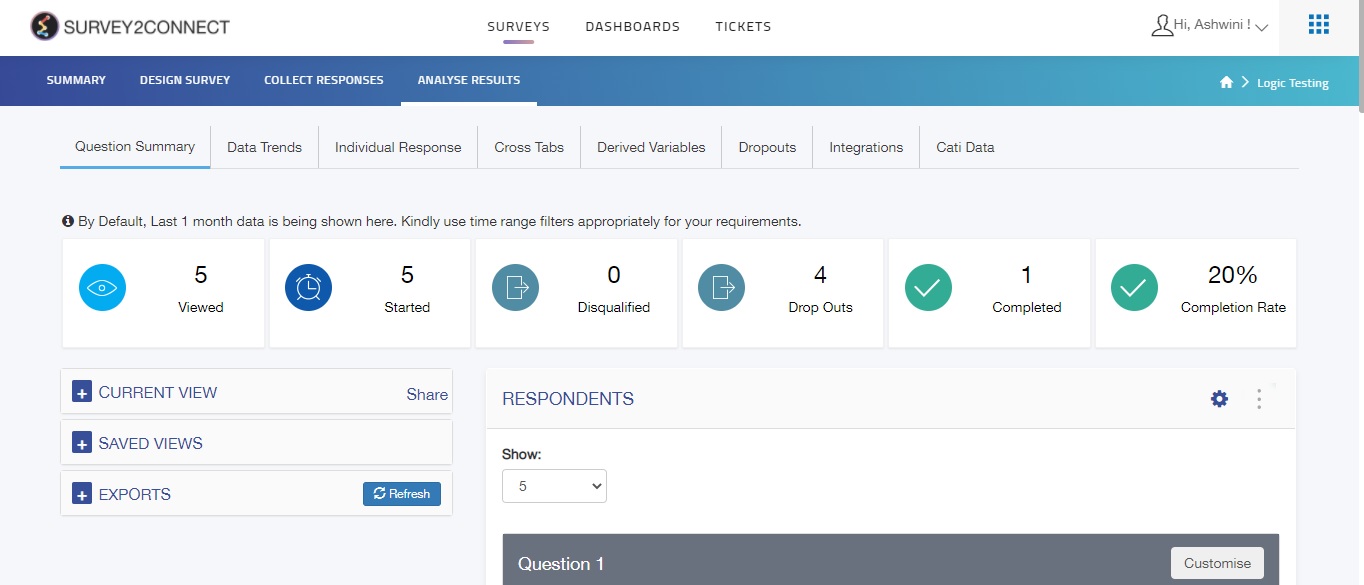
Collection Count
This shows the total number of data set available for analysis. The collection count column shows you all the details for the responses and their types. The available blocks are:
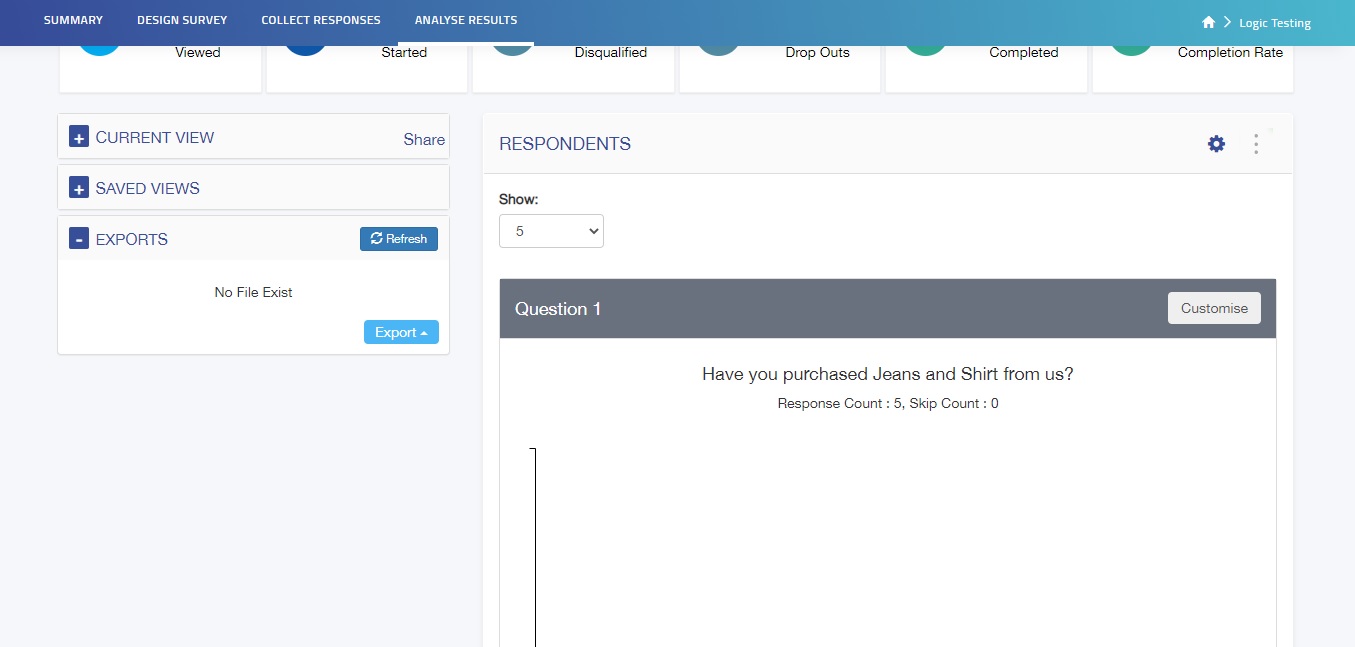
- Viewed: This shows the total number of times your survey was viewed by respondents. Every time a link is opened by respondents, it is counted as viewed.
- Started: This shows you the count of times your survey was started by respondents. Every time respondents manually go to the second question of the survey after responding to the first page, it is counted as Started.
- Disqualified: This shows the total number of survey responses that were disqualified due to either quota or rule
- Drop Outs: This shows the number of respondents that started the survey but closed it without completing
- Completed: This shows the count of total complete responses
- Completion Rate: This shows you the percentage of responses that were completed out of total count of survey responses that were initiated by respondents.
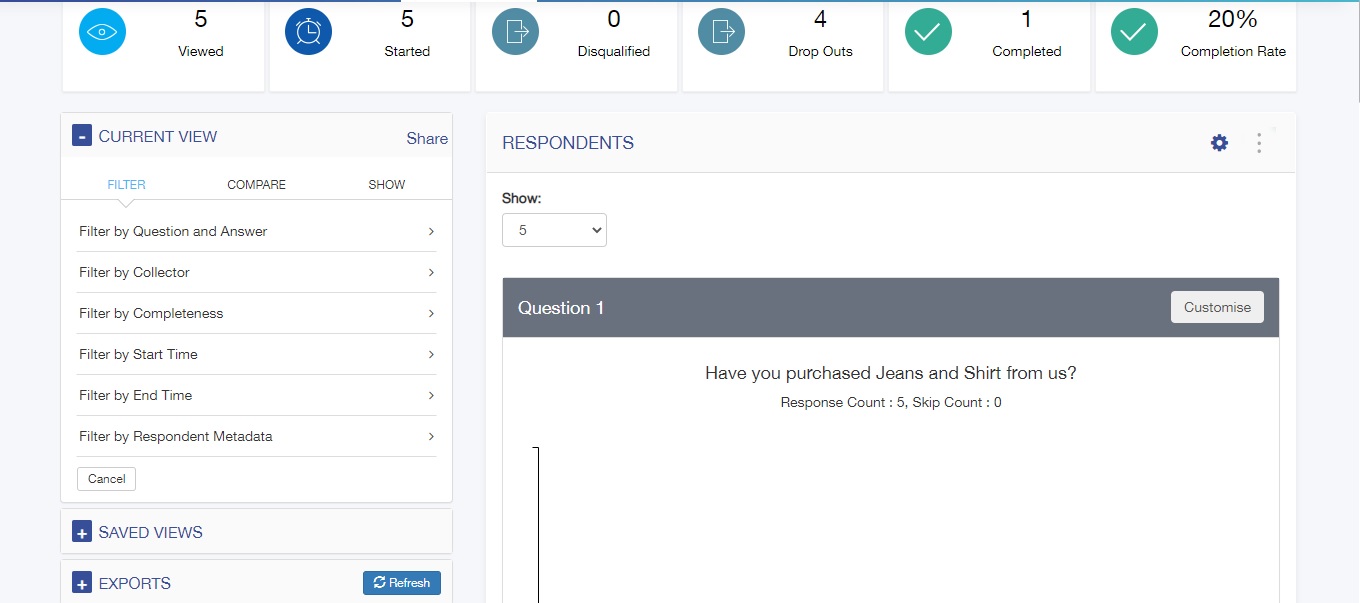
Current View
When you click on Current View, it shows you the default view of your survey responses without any filters or rules. With Current View, you can change the data that appears on the Question summary page. This option allows you to apply rules, compare data, and set what will be shown in the Question summary section. You can use filters to only present the data that’s relevant or useful as per your need. You can also choose to show data from a particular time period or from selected collectors only. You can read more about Current View here.
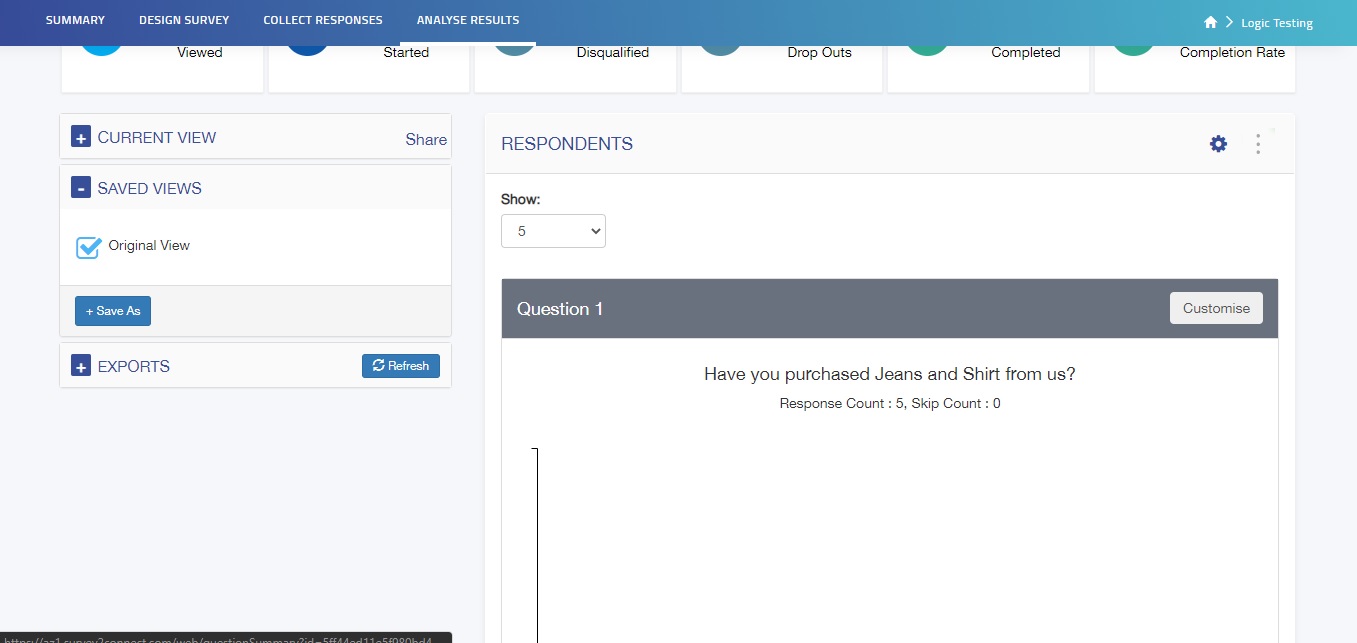
Saved View
Once you have personalized your current views using the available options, you can choose to save them for future references. This option lets you save the view. Also, you can view all your saved views from this option and select the one you wish to view at the moment. This option comes in handy when you have to use different filters at different times. You can set each view separately using this. Read more about Saved View here.
Exports
Export feature helps you view your data in offline mode. This option lets you download your Question summary data that can be accessed without having to visit the platform. This option allows you to export data to share. All your shares would be available here and you can download them manually. You can read more about Exports here.
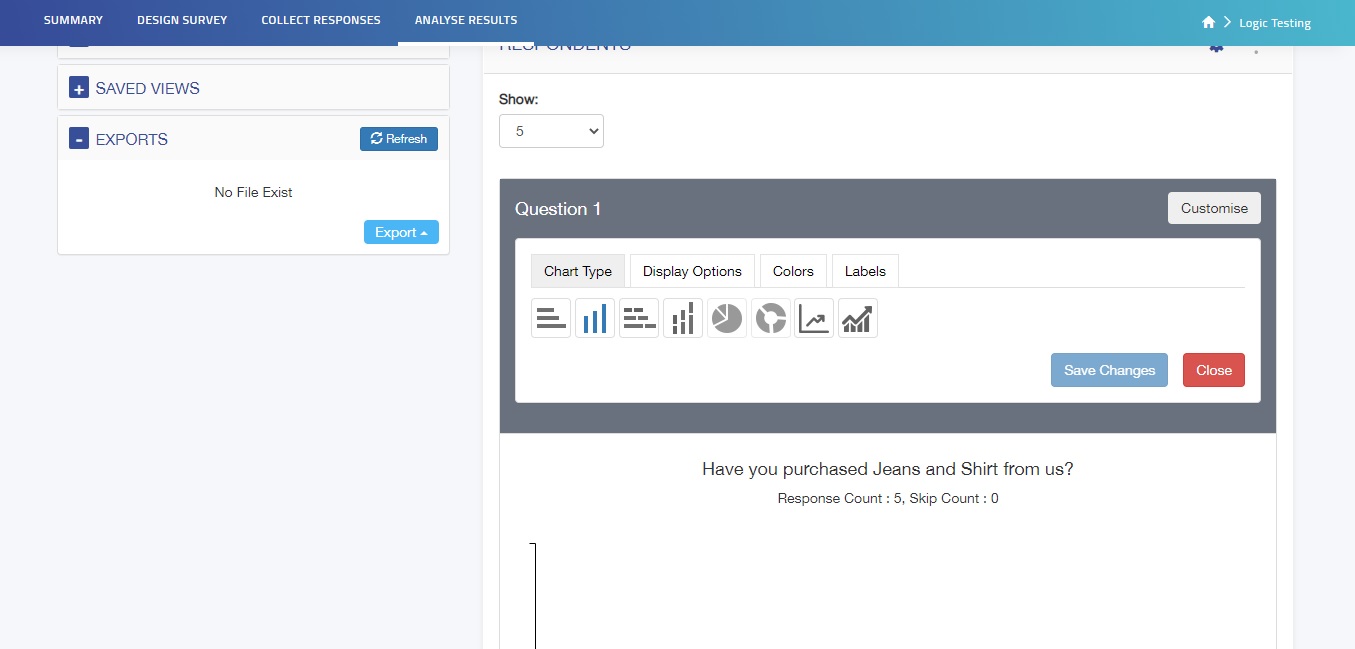
Customize
This option allows you to customize the display of data for each question. When you view the data for each question, you either presented data in a chart type with colors and labels. You can select from Chart Type, Display options, Colors, and Labels. You can also change the appearance of a particular Chart type using the Customise option. Click here to read more about the customize page.