

Data Trends Overview

Views
Data Trends allows you to assess how the data of your respondents have changed over time. Data Trends is used to see if the number of satisfied customers has gone up or down over the course of time. You can check data trends for the overall survey as well as data trend for each question.
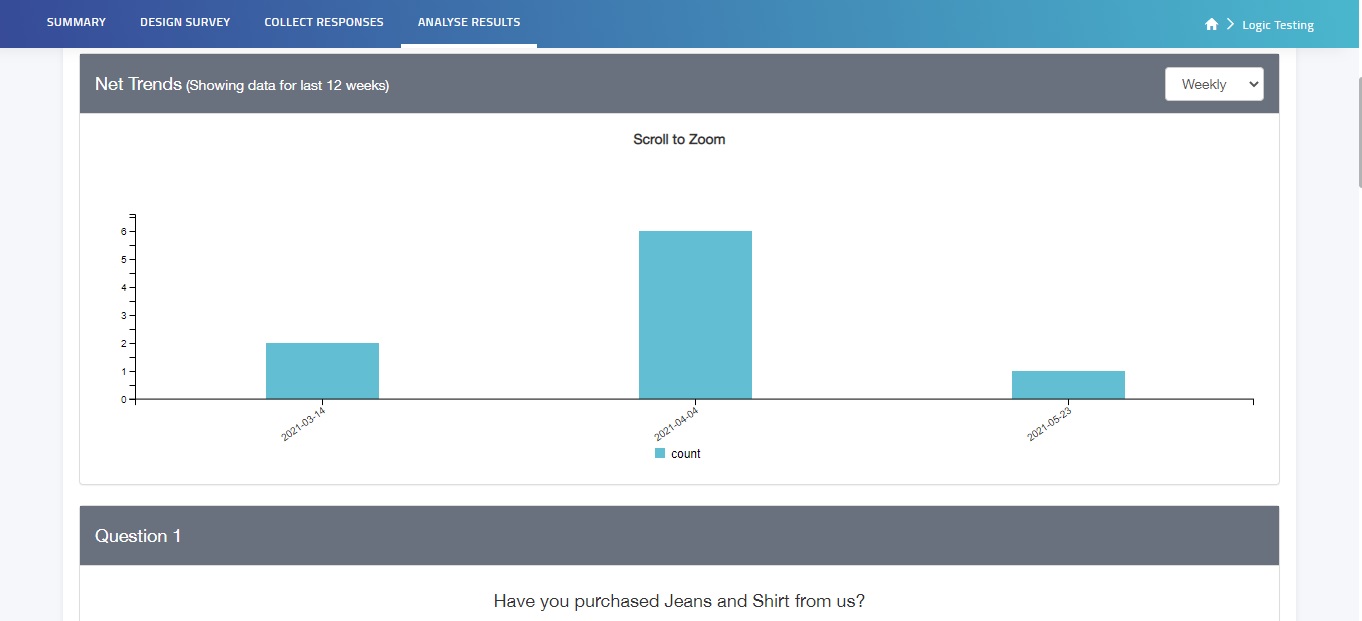
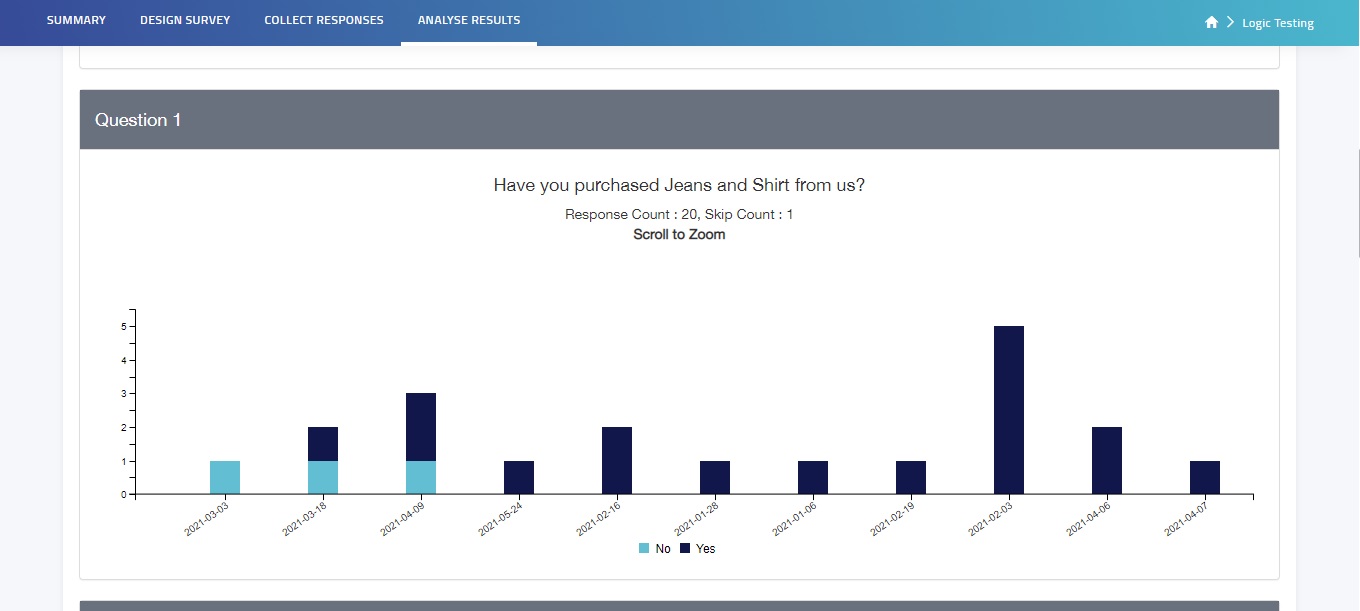
Data trends show you the change in data over a particular period of time. If you select trend over a week, it would show you the change in the data over the period. First, it shows you the change of data on the basis of total responses received over the period. As you proceed further, you can see the change in data for each question of the survey. It shows you increase or decrease of responses for the particular question and individual answer choices.
Note: You can change the trend result by changing the view — Daily, Weekly, Monthly, Yearly.