

Analyse Results Overview

Views
Analyse Results Overview page allows you to analyze all the responses of the survey, predict a data trend alongside cross-tabulations, and download the results for further analysis. There are multiple types of survey analysis available for you in the analyze results section and you will have a brief idea of every feature with this Analyse Results overview.
Question Summary
Question summary allows users to view the analysis of each question in a survey individually. You can see the analysis of all the questions in the form of different types of relevant charts, Tables Etc. Customize the Charts/Tables of each question to see the desired results. Read more about it, here.
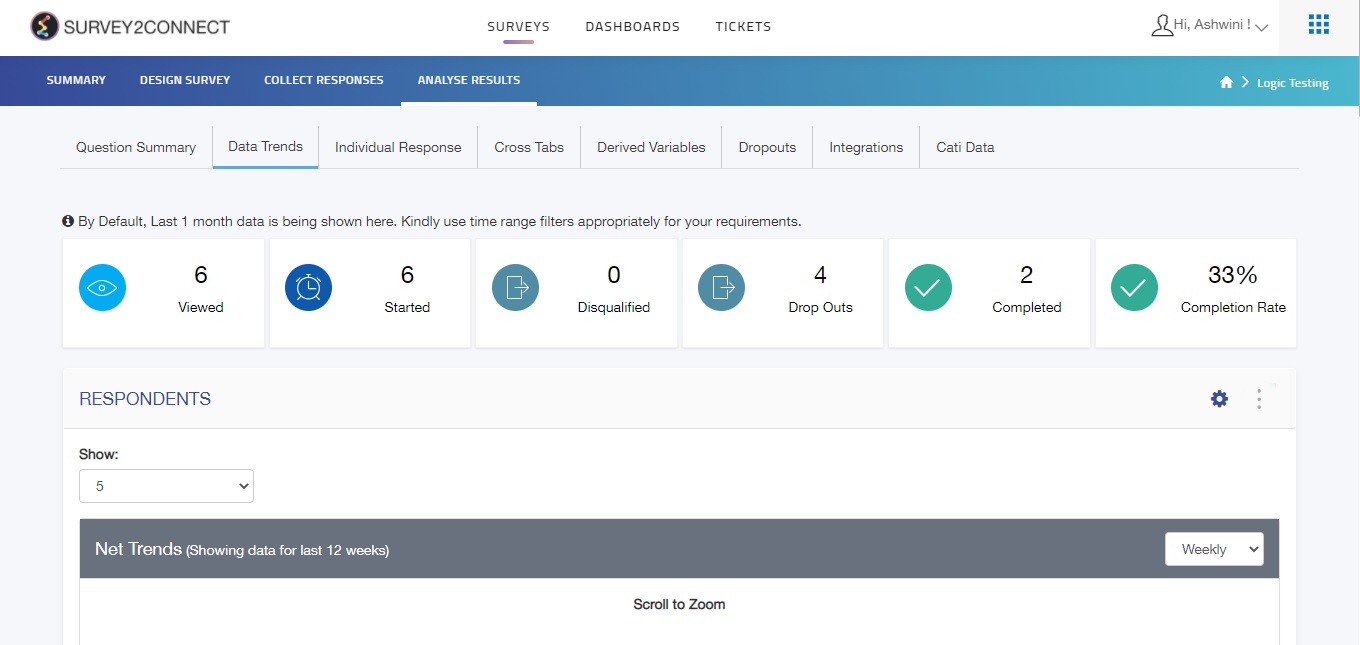
Data Trends
Data Trends by S2C allows you to assess how the data of your respondents have changed over time. Data Trends is used to see if the number of satisfied customers has gone up or down over the course of time. Not only the Data trends of a survey are visible on this page but also trends of each question are visible on this page. Read more about Data trends here.
Individual Response
Individual responses help you to see the response of every person separately. With the help of this feature, you can see respondents’ personal details and his response to every question. You can not only see the response but also you can edit/delete a response from the individual responses page. This also allows you to change the language of this page to any of the language used in the survey. Printing of a response is also possible through this page. You can read more about Individual Responses, here.
Cross Tabs
Cross Tabs tool helps you in understanding the correlation between different variables. It shows how correlations change from one variable grouping to another. Through Cross tabs, you can perform multiple type analyses on two variables or more at a time or even create multiple cross tabs at once. You can customize your crosstabs, including the ability to calculate Chi-squared, p-Value and Degree of freedom, and much more. You can read more about Cross Tabs, here.
Derived Variables
Derived variables allow you to create and add new custom variables to responses after they’ve already been recorded. You can categorize your respondents based on their responses or a pattern of responses to the survey. Derived Variables can be used in exporting raw data, creating advanced dashboards, or creating Cross tabs. Click here to read more about Derived Variables.
Dropouts
Survey dropout is the percentage of the people who have not responded to a question due to certain reasons such as complexity of the question, technical glitches, lack of interest, and many more. The analysis of such dropout rates is called Dropout analysis.
The drop-out analysis is useful in certain decisions like which type of question to use, restricting the length of the survey, sending timely reminders, deciding the flow of the survey, and much more. In the Dropouts section, you can access the complete analysis of the survey dropouts. Read more about Dropouts here.
Integrations
Integration section allows you to integrate other powerful analytics tools to further analyze your survey data. You can integrate your survey with Power BI and help you create an intuitive dashboard. You can read more about it here.